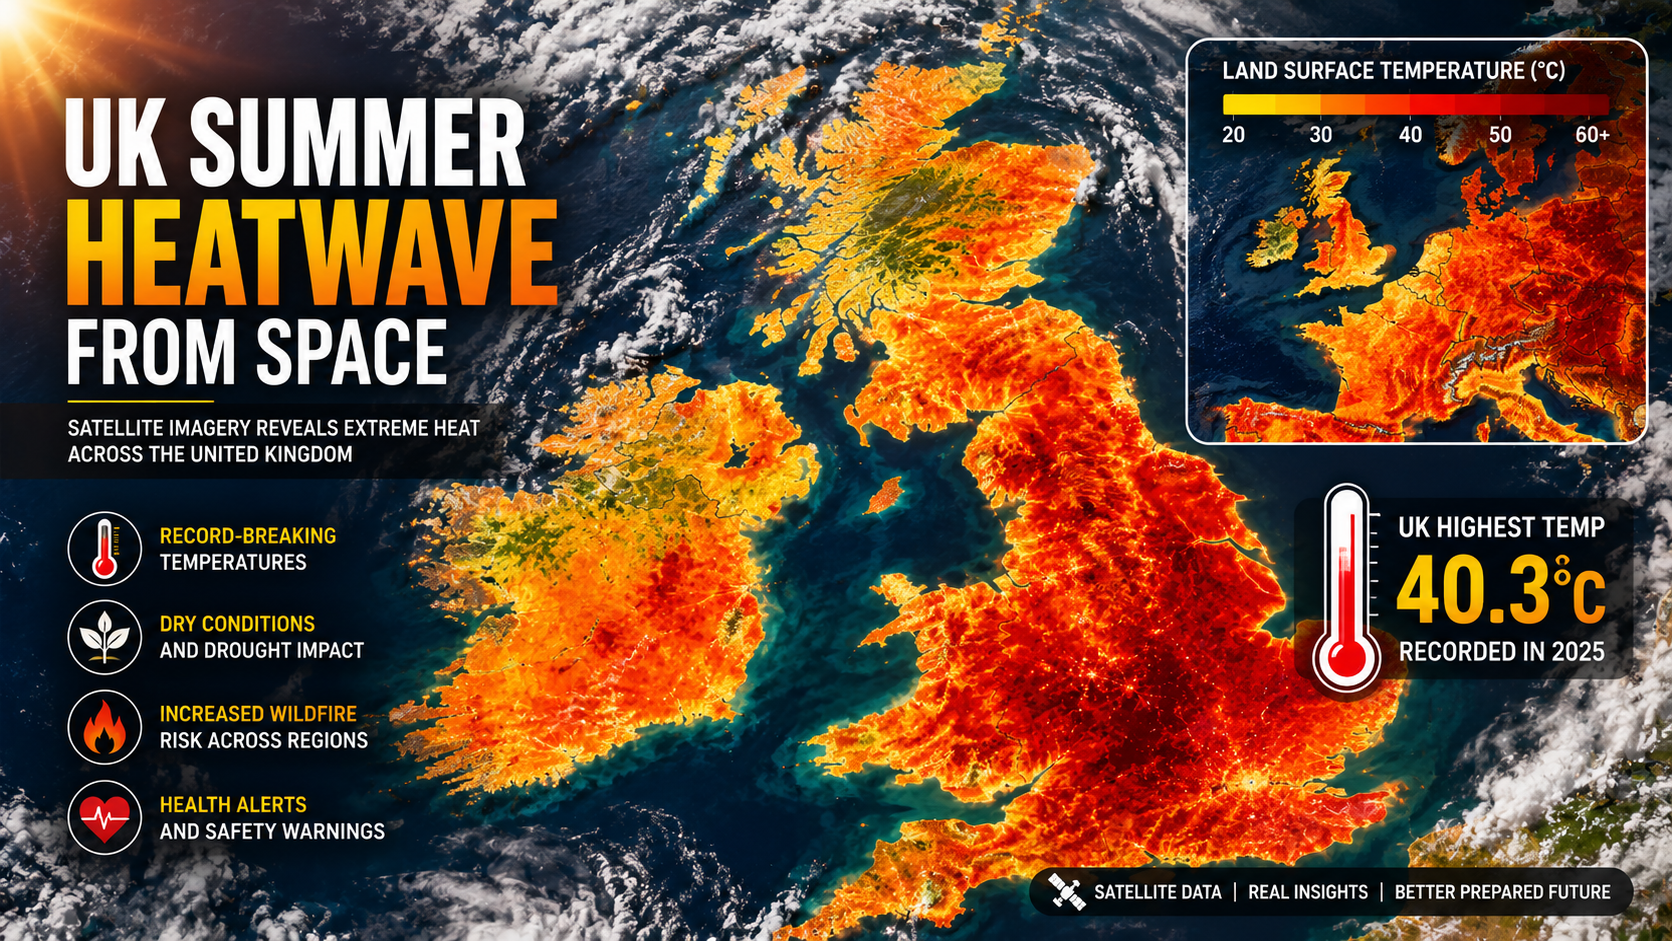
The UK Summer Heatwave Satellite Imagery has become an invaluable tool for meteorologists, climate scientists, and emergency planners seeking to understand how extreme temperatures develop and spread across the country. Modern satellite technology provides real-time images and detailed environmental data, allowing experts to monitor heatwaves with greater accuracy than ever before.
In recent years, the United Kingdom has experienced increasingly intense summer heatwaves, breaking temperature records and placing pressure on public health services, infrastructure, agriculture, and energy systems. Satellite imagery offers a bird’s-eye view of these events, helping scientists analyze land temperatures, cloud movement, vegetation health, wildfire risks, and atmospheric conditions.
As climate patterns continue to evolve, satellite monitoring has become one of the most important technologies for forecasting extreme weather and supporting timely public safety decisions. This article explores how satellite imagery works, why it matters during UK heatwaves, and what it reveals about changing weather patterns.
What Is UK Summer Heatwave Satellite Imagery?
Satellite imagery refers to photographs and sensor data collected by weather and Earth-observation satellites orbiting the planet.
During a heatwave, satellites monitor several environmental conditions, including:
Land surface temperatures
Cloud cover
Atmospheric moisture
Vegetation health
Wildfire activity
Air quality
Ocean temperatures
These observations help meteorologists understand how a heatwave develops, intensifies, and eventually weakens.
How Weather Satellites Monitor Heatwaves
Unlike ground weather stations that record conditions at specific locations, satellites provide a much broader view.
Using infrared and visible-light sensors, satellites can observe:
Temperature distribution
Movement of weather systems
Solar radiation
Surface heating
Changes in vegetation
This information allows weather agencies to monitor the entire UK simultaneously.
Types of Satellites Used
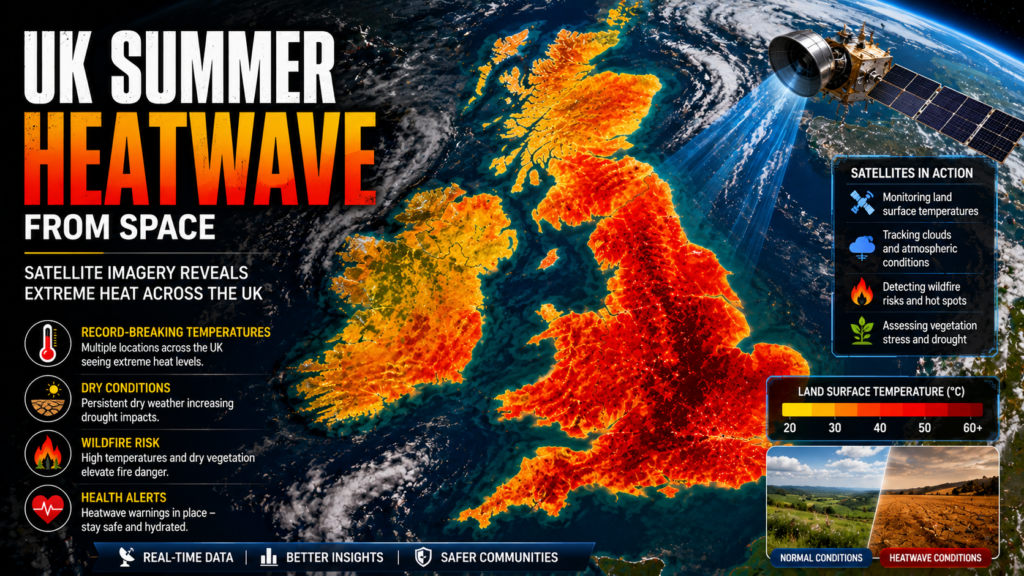
Several types of satellites contribute to weather monitoring.
Geostationary Satellites
These satellites remain positioned above the same area of Earth.
They provide:
Continuous monitoring
Frequent image updates
Cloud tracking
Storm development
Heatwave progression
Their constant observations are ideal for weather forecasting.
Polar-Orbiting Satellites
Polar satellites travel around Earth from pole to pole.
They produce:
High-resolution imagery
Detailed land observations
Accurate temperature measurements
Environmental monitoring
Although they pass over the UK less frequently, they provide highly detailed information.
What Satellite Images Reveal During Heatwaves
Satellite imagery helps scientists observe several important environmental changes.
Surface Temperature
Infrared sensors measure land surface temperatures.
Urban areas often appear significantly warmer than surrounding countryside because buildings and roads absorb more heat.
This phenomenon is known as the Urban Heat Island Effect.
Vegetation Stress
Healthy vegetation reflects light differently than dry or damaged plants.
Satellite data helps identify:
Dry farmland
Drought conditions
Forest stress
Reduced crop health
This information supports agricultural planning.
Wildfire Risk
Hot, dry conditions increase wildfire potential.
Satellites help detect:
Smoke plumes
Active fires
Burned vegetation
Fire spread
Emergency responders use this information to allocate resources quickly.
Why Heatwaves Are Increasing
Scientists attribute the growing frequency of heatwaves to multiple factors.
These include:
Climate change
Global warming
Changing atmospheric circulation
Urban development
Reduced natural cooling
Although individual weather events have many contributing factors, long-term climate trends indicate that extreme heat is becoming more common.
Impact on UK Cities
Large cities often experience higher temperatures than nearby rural regions.
Satellite imagery clearly highlights these differences.
Cities absorb and retain heat because of:
Concrete
Road surfaces
Buildings
Limited green spaces
Reduced airflow
Urban planners increasingly use satellite data to improve city design.
Effects on Agriculture
Extreme heat can significantly affect farming.
Satellite monitoring helps identify:
Water shortages
Crop stress
Soil moisture loss
Irrigation needs
Harvest planning
Farmers can make better decisions using this information.
Monitoring Water Resources
Heatwaves increase evaporation from rivers, lakes, and reservoirs.
Satellite observations assist authorities in tracking:
Water levels
Reservoir conditions
Drought development
River temperatures
Water management agencies use these insights to plan conservation measures.
Public Health Benefits
Extreme temperatures present serious health risks, particularly for:
Older adults
Young children
Outdoor workers
People with chronic illnesses
Satellite-based forecasting enables governments to issue heat-health warnings before temperatures reach dangerous levels.
Early warnings help communities prepare.
Air Quality Monitoring
Heatwaves can worsen air pollution.
Satellites monitor:
Dust
Smoke
Ozone levels
Aerosols
Pollution transport
These observations improve public health advisories.
Supporting Weather Forecasts
Satellite imagery plays a vital role in weather prediction.
Combined with computer models and ground observations, satellites improve forecast accuracy by tracking:
Cloud development
Humidity
Pressure systems
Temperature trends
Wind patterns
This information helps meteorologists predict the duration and intensity of heatwaves.
Climate Research
Long-term satellite observations allow scientists to compare today’s conditions with historical records.
Researchers analyze:
Temperature trends
Seasonal changes
Vegetation patterns
Ice coverage
Ocean temperatures
These studies improve understanding of Earth’s changing climate.
Technology Behind Modern Satellites
Today’s Earth-observation satellites use advanced instruments capable of collecting enormous amounts of environmental data.
Technologies include:
Infrared sensors
Multispectral imaging
Thermal imaging
Microwave sensors
Radar systems
Artificial intelligence also helps analyze large satellite datasets more efficiently.
How Satellite Data Helps Emergency Services
Emergency management teams rely on satellite information during extreme weather.
Applications include:
Wildfire monitoring
Flood forecasting
Infrastructure assessment
Transportation planning
Disaster response
Accurate environmental data supports faster decision-making.
Challenges of Monitoring Heatwaves
Although satellite technology has advanced significantly, certain limitations remain.
These include:
Cloud interference
Sensor calibration
Data processing time
Spatial resolution differences
Integration with ground observations
Scientists continuously improve monitoring systems to overcome these challenges.
The Future of Heatwave Monitoring
Future weather satellites are expected to provide:
Higher-resolution imagery
Faster updates
Improved temperature measurements
Advanced AI analysis
Enhanced climate monitoring
These improvements will strengthen forecasting and emergency preparedness.
Why Satellite Imagery Matters
Satellite imagery provides a comprehensive perspective that cannot be achieved through ground-based observations alone.
It supports:
Weather forecasting
Climate science
Agriculture
Urban planning
Environmental protection
Public safety
As extreme weather events become more frequent, satellite monitoring will play an increasingly important role.
Final Thoughts
UK summer heatwave satellite imagery has transformed how scientists monitor and understand extreme weather. By providing real-time observations of land temperatures, vegetation, atmospheric conditions, and wildfire risks, satellites help governments, researchers, and emergency services respond more effectively to heatwaves.
Beyond weather forecasting, satellite technology contributes to agriculture, environmental conservation, climate research, and public health. As new generations of Earth-observation satellites become operational, forecasting accuracy and environmental monitoring capabilities will continue to improve.
Understanding how satellites observe heatwaves not only highlights the importance of space technology but also demonstrates how scientific innovation helps societies prepare for a changing climate.
Stay connected with Inetfreak for the latest technology news, satellite innovations, climate research, AI developments, and global science updates.
Frequently Asked Questions (FAQs)
What is UK summer heatwave satellite imagery?
It refers to images and environmental data collected by Earth-observation satellites to monitor extreme heat, land temperatures, vegetation, clouds, and atmospheric conditions across the UK.
How do satellites detect heatwaves?
Satellites use infrared and thermal sensors to measure land surface temperatures, track weather systems, and observe environmental changes associated with extreme heat.
Why is satellite imagery important during heatwaves?
It improves weather forecasting, helps monitor wildfire risks, supports agriculture, and enables authorities to issue early heat-health warnings.
Can satellite imagery predict heatwaves?
Satellite data is combined with weather models and ground observations to improve forecasts, but no single satellite image can predict future weather on its own.
How does climate change affect UK heatwaves?
Many climate studies indicate that rising global temperatures are increasing the likelihood and intensity of extreme heat events, although individual weather events result from multiple interacting factors.
This website is proudly managed by Shunya Digit